|
微波射频仿真设计 |
|
|
微波射频仿真设计 |
|
| 首页 >> Ansoft Designer >> Ansoft Designer在线帮助文档 |
|
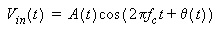
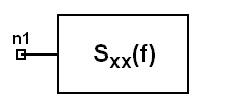
System Simulator > Power Spectral Density Probe (PSDP)
Notes1. For a given random input signal
this model takes blocks of the incoming input samples ( each block of length FFTL samples), and computes the resulting power spectrum density S(w) for each block according to
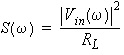
where Vin(w) is the frequency spectrum of the input complex envelope ( A(t)ejq(t) ) computed using an FFT of length FFTL, and RL is the impedance used to calculate the PSD. 2. The resulting power spectrum is then averaged out over the total number of available input blocks (each of length FFTL samples). The averaging process is done according to the Welch Method [1] for spectral estimation. The averaging process becomes more accurate as more input samples are used in the estimation process. The averaging process then yields an estimate of the power spectral density of the random input signal. 3. The user should set the TYPE parameter to 0 if the expected spectral estimate is continuous. Non-periodic signals always yield continuous power spectral densities. If, on the other hand, the spectral estimate is expected to be discrete (i.e., input is periodic), the user should set the TYPE parameter to 1. 4. It is important to note that from a software point of view, a periodic signal (e.g., a sinusoid) will not yield a discrete spectrum unless the frequency of the periodic signal, the simulation time step, and the number of samples representing the signal all meet a certain criterion. Netlist FormPSDP:Name n1 FFTL=val [TYPE=val] [WINDOW_TYPE=val][INITSAMP=val] Netlist ExamplePSDP:My_Psdp 1 FFTL=256 Window_type=2 TYPE=0 References1. J. G. Proakis and D. G. Manolakis, “Introduction to Digital Signal Processing”, Macmillan
HFSS视频教程 ADS视频教程 CST视频教程 Ansoft Designer 中文教程 |
||||||||||||||||||||||||||||||||||||||||||||||||||||
|
Copyright © 2006 - 2013 微波EDA网, All Rights Reserved 业务联系:mweda@163.com |
|