|
微波射频仿真设计 |
|
|
微波射频仿真设计 |
|
| 首页 >> Ansoft Designer >> Ansoft Designer在线帮助文档 |
|
Nexxim Simulator > CTLE Visualization
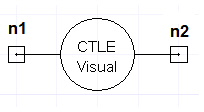 CTLE Visualization Instance Netlist SyntaxThe Continuous-Time Linear Equalization (CTLE) visualization element allows you to preview the waveform generated for a given CTLE setting during QuickEye or VerifEye analysis. The syntax for a CTLE visualization instance is: ACTLExxxx n2 n2ref n1 n1ref internal p1=val p2=val z=val gain=val COMPONENT=ctle n1 is the input node, n2 is the output node of the equalizer. n1ref and n2ref are the reference nodes for the input and output, respectively, and are typically grounded (node 0). The internal node is required, and should not be connected to any signal or ground. The entry COMPONENT=ctle identifies the device. Refer to Continuous Time Linear Equalization in the QuickEye and VerifEye Technical Notes for details.
CLTLE Visualization Element Netlist ExampleACTLE123 out 0 in 0 internal p1=20 gaindb=10 oip2db=20
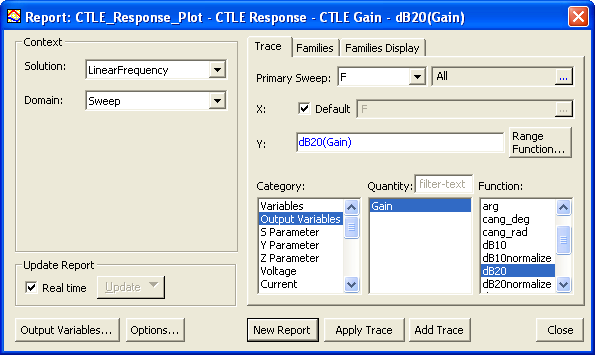
r1=50 r2=50 Notes1. Set up and run a linear network analysis (LNA) for the frequency range of interest. 2. Create a standard rectangular report from the LNA Solution, Sweep domain, using Output Variables as the Category, Gain as the Quantity,dB20 as the Function, and All Frequencies as the Primary Sweep. The setup should look like the following:
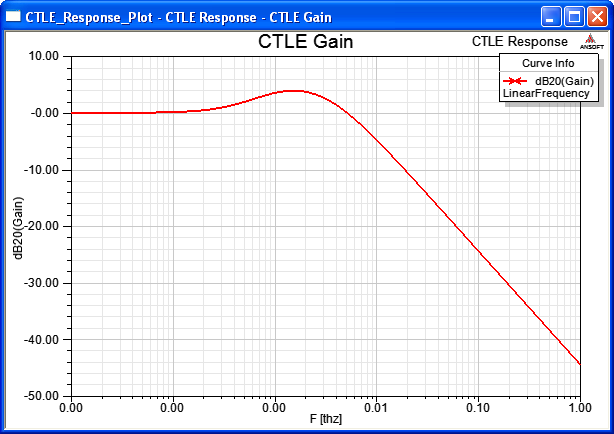
When the report opens, click on the horizontal axis (Frequency), open the axis properties window Scaling tab and select Log scaling. The report should look like the following:
HFSS视频教程 ADS视频教程 CST视频教程 Ansoft Designer 中文教程 |
|
Copyright © 2006 - 2013 微波EDA网, All Rights Reserved 业务联系:mweda@163.com |
|