
 <Result Plot>
  Result Plot List
Activate the option Navigation
Tree:
2D/ 3D Results
 <Result Plot>
  Overlay
Multiple Plots.
Generate your first plot; for instance, an arrow plot of an electric field
Click "store" in this (List of Result Plots) dialog box. You will then be asked to give your plot a name.
Generate a new plot; for example, by selecting an H-field monitor from the navigation tree.
All selected plots in the list will be laid over the current plot. Try changing the color ramp for more clarity.
Store
Stores the current plot and all settings like scaling, phase, color ramp. After the plot has been stored, it cannot be modified further. It can, however, still be zoomed, rotated or panned.
Deselect all
Deselect all plots in the above list.
Delete
Deletes all selected plots in the above list.
Help
Shows this help text.
Close
Closes this dialog box without performing any further action.
Example
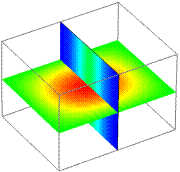
Left: two overlaid arrow plots. Right: two overlaid 2D cuts.

See also