|
微波射频仿真设计 |
|
|
微波射频仿真设计 |
|
| 首页 >> Ansoft Designer >> Ansoft Designer在线帮助文档 |
|
System Simulator > Matched Filter (MATCHFILTER)

Limits

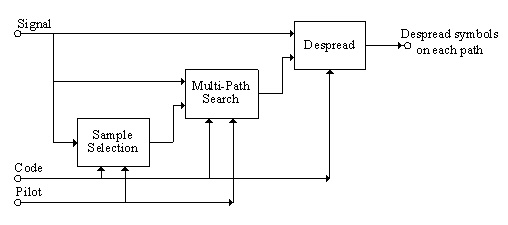
Notes1. The matched filter model can be used to resolve
the received multi-path signal and despread symbols on each path in
DS/CDMA systems. The block diagram of the matched filter is shown in
Fig.1. If Method is set to Pilot Assisted {0}, the received
signal is despread using the estimated multi-path delays (i.e.,
the output of the Multi-Path Search). If Method is set to Perfect
{1}, the received signal is despread using the given parameter values
D0 ~ DL-1.
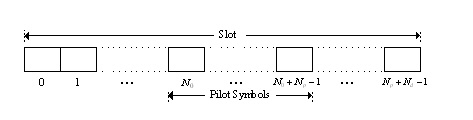
2. Slot Structure
3. Sample Selection: Because of channel delay and
shaping filter, the optimum sample position should be found to maximize
the output power and minimize inter-symbol interference. The input signal
is a discrete one sampled at the rate of 1/Ts
in simulation. To determine the optimum sample position is to
select an optimum sample from the S samples during a chip. The
optimum sample position can be determined by comparing correlation values
between the received signal starting at each sample point and the corresponding
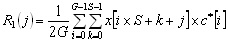
spreading code. 4. where G is the spreading factor and S
is the number of samples per chip and the vector c [ ] stores
the corresponding spreading code. The factor 1/2 is used to remove
changes of symbol power caused by spreading and despreading. When the
jth sample point of input signal hits the first chip of that
symbol (which is spread by the spreading code c [ ]), the magnitude
of the correlation value will be the greatest among these samples.
5. Multi-Path Search: The transmitted signal arrives
at the receiver via different paths and delays. To use more signal power,
multi-path delays of the received signal of the desired user are determined
and signals on each resolved paths are combined. Because it is difficult
to determine the relative multi-path delays at the precision of
TS, multi-path delays are determined at the precision of
Tc, where Dc =
Tc x S is chip duration. Let Dc
be the maximum delay in terms of chips, i.e., Dc
equals the largest integer which is not larger than Dc/S,
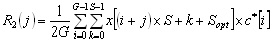
can be expressed as 6. After the optimum sample position DOPT
has been determined by Sample Selection, the correlation values
between the received signal at each possible delay, in terms of chips,
are calculated as follows: 7. As in Sample Selection, the correlation values of different pilot symbols on the same path are divided by the corresponding pilot symbol values and added. Dc + 1 results of additions are obtained. In these results, L with the greatest magnitude are selected, the corresponding paths that belong to L results are determined as L valid paths. The Multi-Path Search process can also use the block-average power delay profile (K>1) [3]. 8. Despread: After multi-path delays are obtained by the Multi-Path Search, symbols on each path in current slot are despread. If Method is set to Perfect {1}, symbols on each path in current slot are despread using the given parameter values D0~DL-1, rather than the multi-path delays are obtained by the Multi-Path Search. The despreading process is the same as the process of calculating correlation value. Finally, L samples are outputted successively for each symbol. Netlist FormMATCHFILTER:NAME n1 n2 n3 n4 [METHOD=val] L=val G=val [S=val] [K=val] NP=val ND=val + [N0=val] [DMAX=val] [D0=val,…, D15=val] [RIN1=val] [RIN2=val] [RIN3=val] [ROUT=val] Netlist ExampleMATCHFILTER:1 1 2 3 4 METHOD = 0 L =2 G = 32 S = 4 DMAX = 20 NP = 4 ND = 16 D0 = 1 D1 = 9 References1. J. G. Proakis, Digital Communications, McGraw-Hill, 2001. 2. A. J. Viterbi, CDMA: Principles of Spread Spectrum Communication, Wesley Publishing Company, 1995. 3. K. Higuchi, H. Andoh, et al, “Experimental evaluation of combined effect of coherent RAKE combining and SIR-based fast transmit power control for reverse link of DS-CDMA mobile radio,” IEEE Journal on Selected Areas in Communications, vol. 18, No.8, pp.1526-1535, Aug. 2000.
HFSS视频教程 ADS视频教程 CST视频教程 Ansoft Designer 中文教程 |
||||||||||||||||||||||||||||||||||||||||||||||||||||||||||||||||||||||||||||||||||||||||||||||||||||||
|
Copyright © 2006 - 2013 微波EDA网, All Rights Reserved 业务联系:mweda@163.com |
|
 (1)
(1) (2)
(2) (3)
(3)